5 reports you should be automating in Google Analytics
Google Analytics offers tons of data points and insight into your website but sometimes you or someone else at your property doesn’t need all of that data and wants a high level overview of their important metrics. With automated reports, you can email these high level snapshots on a regular basis so everyone is in the loop on how certain metrics are performing.
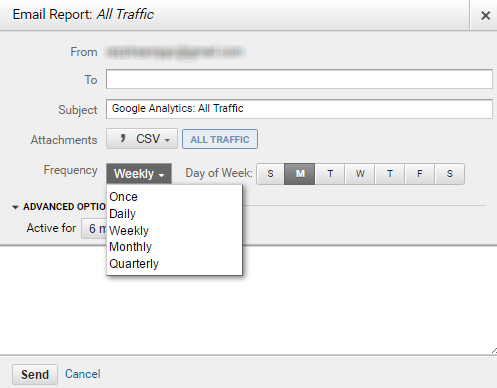
You can send these automatic emails to specific email addresses and set the subject line, how the report attaches to the email, how frequent and the day of the week, and the duration.
Here are the top five reports we recommend automating:
Channels
This report will show you what channel is bringing in the most traffic, the average bounce rate, your ecommerce conversion rate, transactions, and revenue. Channels include your Organic Search, Paid, Direct (people typing in your website), Referral, Social, and Email.
Set up this report: Go to Google Analytics and select Acquisition from the left-side menu > All Traffic > Channels
Source/Medium
This report shows you the actual source of your traffic and the medium. For example, your number one spot on this report is for google/cpc, this means that an ad on Google is bringing in the most traffic (these reports are typically organized by sessions). You can see what sites (the source) and mediums (ads, business listings, organic searches) are bringing in quality traffic that results in a strong conversion rate.
Set up this report: Go to Google Analytics and select Acquisition > All Traffic > Source/Medium
Referrals
Are external sites or directories sending traffic your way? Monitor the performance of other websites linking to yours with the referrals report.
Set up this report: Go to Google Analytics and select Acquisition > All Traffic > Referrals
Mobile
We live in a mobile-first world and it’s important to know how your website is performing on mobile devices and especially with conversions. You may also want to pay attention to the bounce rate and % new sessions to make sure your content is optimized and meeting the needs of searchers.
Set up this report: Go to Google Analytics and select Audience > Mobile > Overview
Landing Pages
Find out what content is pulling people in from searches or other websites to make any improvements or changes necessary. Check the bounce rates, time on site, and % new visitors to see if your content is engaging.
Set up this report: Go to Google Analytics and select Behavior > Site Content > Landing Pages
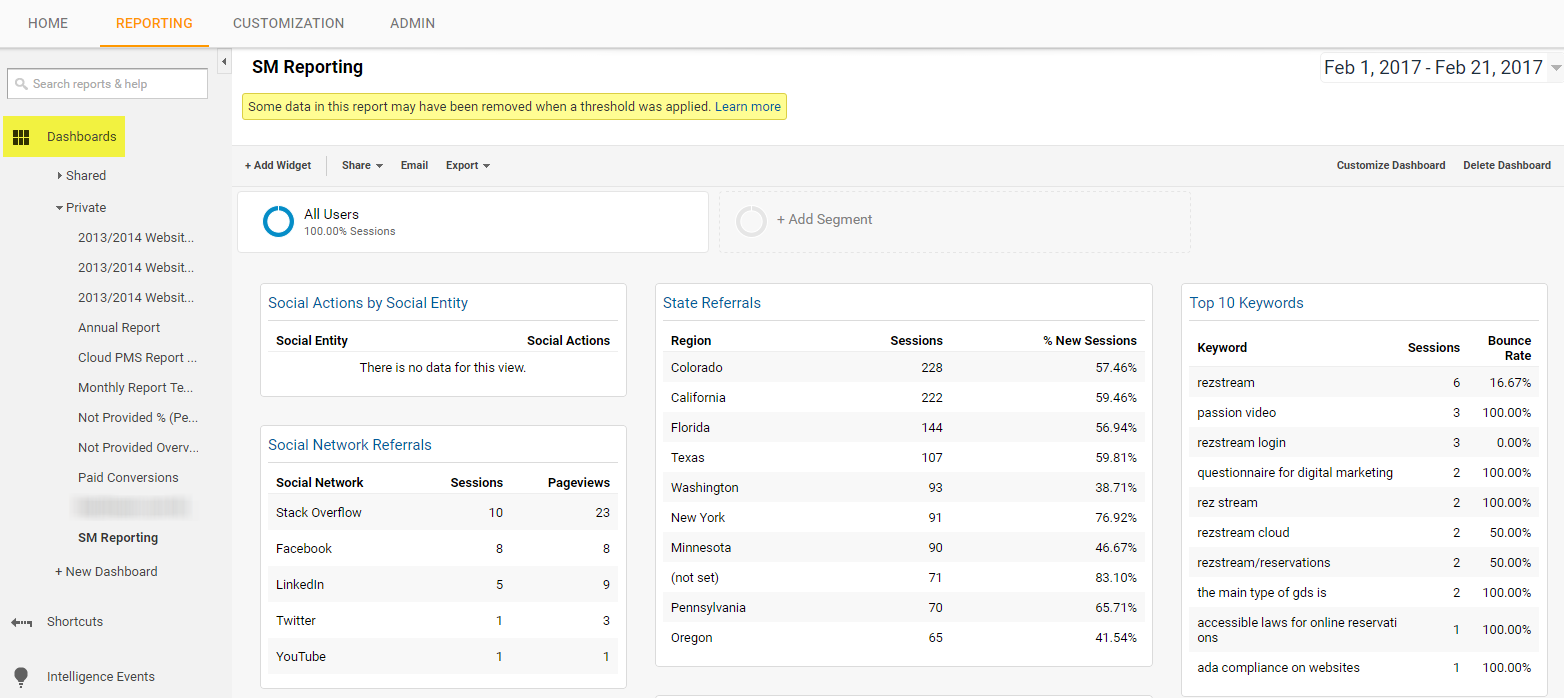
Another option for reporting is through creating dashboards. A dashboard can include 12 widgets (mini reports) to provide a great overview of what’s going on with your data. It can show you that your website traffic is up but it can’t show you exactly what campaign drove that spike in traffic – but reports can. Obviously, you can create a mix and match of reports and dashboards (which can also be automatically emailed on a regular basis) to ensure you’ve got a decent big picture view of your website’s data.
Want more insight on reporting in Google Analytics? Watch the recording of our “How to Measure Internet Marketing Performance” webinar.